Create-electron-app is a boilerplate project for Electron applications. One of the challenging tasks in an electron project is setting up the initial configuration of the application with an UI framework support. Initial configuration includes Electron integration, folder structure, UI framework for the renderer processes, style framework, code bundling, packaging, etc. The Create-electron-app boilerplate is a combination of Electron, React, and Redux, with the build and package scripts, signifying the ability to initiate a project without spending a lot of time in the initial configurations.
Folder Structure
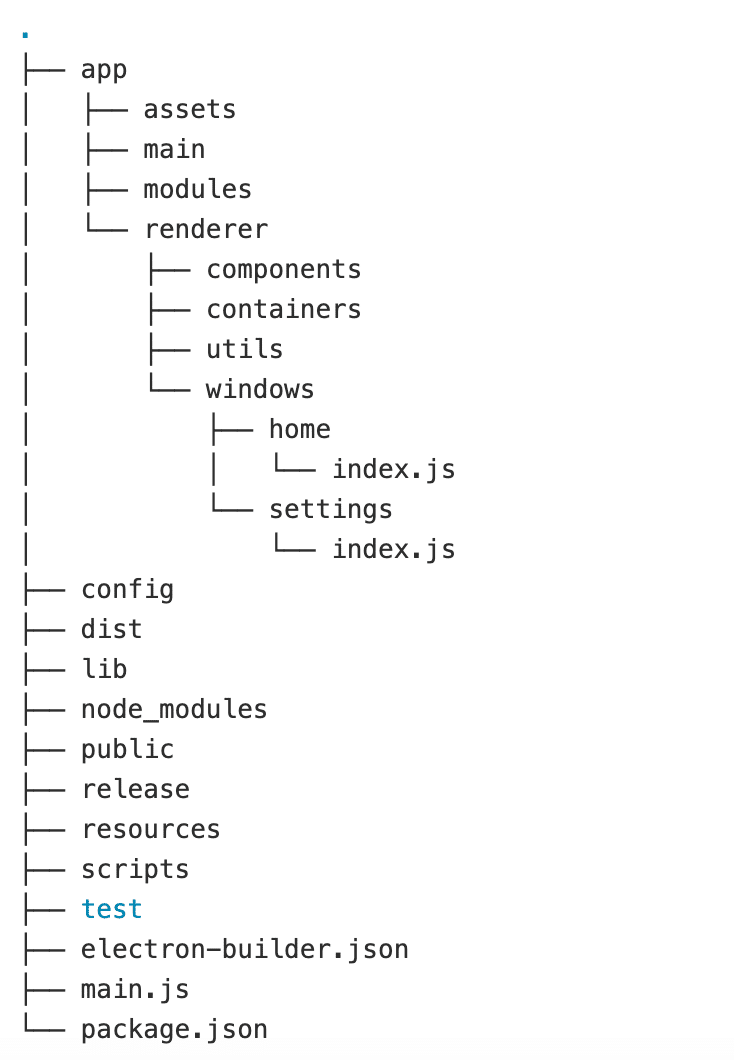
The application code is principally divided into two-main folders and renderer. The main folder contains all the key process codes and related modules, while the UI related code and modules come under the renderer process folder. Apart from that, there are a few more folders in the app directory such as assets, modules, actions, reducers, etc. The modules folder carries all the shared modules that are used in both main and renderer processes.
Multi-window Architecture
Create-electron-app supports multi-window architecture, and the folder structure is designed in such a way that all the window codes (renderer/windows) are bundled into separate app files (HTML, CSS, and JS). Additionally, all third-party codes in the renderer process are packaged into “vendor.bundle.js” and injected in all the React apps. The primary reason is to reduce the output package size as much as possible, and here, every window is a separate React single page application.
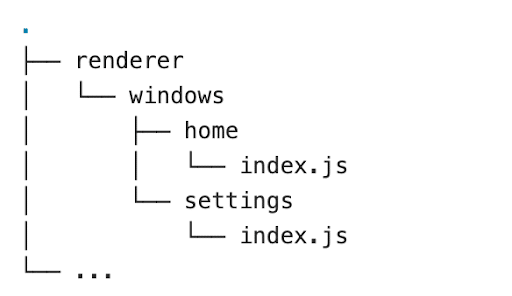
So some coding standards must be followed in the renderer processes. All the screens/windows should be a React app inside the “app > renderer > windows” folder. Each window should have a unique name, and that name should be the name of the folder.
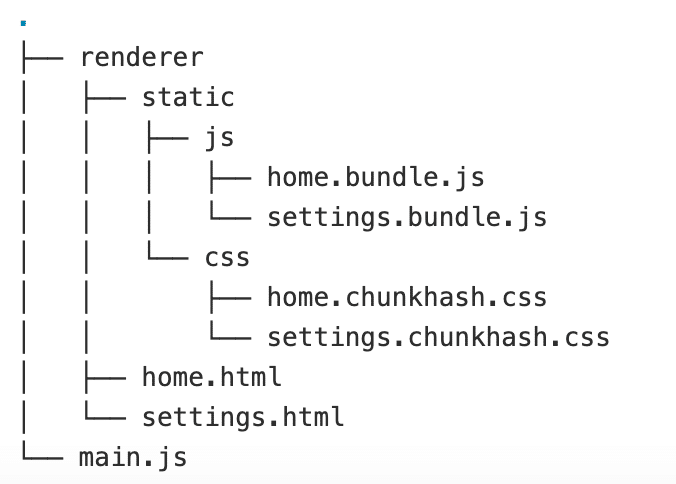
Here “home” and “settings” are the two windows, and these are two different React applications. The bundle script compiles these applications into the “dist” folder in the following structure:
Now”home.html” can be loaded inside the home window and “settings.html” inside the settings window.
Application Data Management
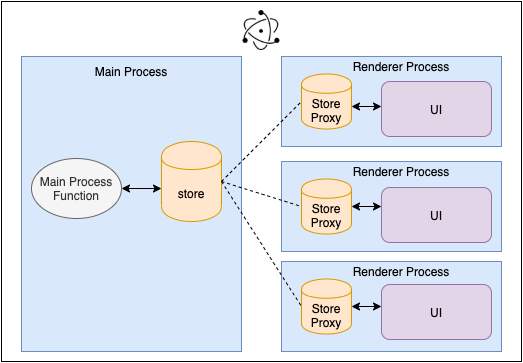
React is the default UI framework. In Electron, each window has a different process, and hence, the application data also should be shared across the processes. Here, we have used Redux for application data management. Since Redux follows the “single source of truth” principle, we cannot have multiple copies of the store in an application. Wondering how to share the stored data with all the processes in an Electron application? For this, we need to configure the data in the main process as a single source of truth and create proxy stores in each of the renderer processes.
Here, the proxy stores listen to the changes in the main store and update themselves immediately. Also, the changes in the proxy store are updated in the main store immediately so that other proxy stores also get updated in tune with the new changes.
Preload Script
You can write the preload script inside the “app/preload” folder. The preload script is compiled into the dist folder(dist/preloads), and each preload script should be inside a separate folder. The bundle script completes the code, and the output bundle is created based on the folder name. For example, your preload folder name is “mainwindowPreload”, the bundle script generates a “mainwindowPreload.bundle.js” in the dist/preloads folder.
Development
Start the development server using the following command:
npm start
The development server listens to the port 3000. Hot reloading is enabled by default, and it helps to test the code changes without restarting the development server every time.
Testing
The unit testing framework is integrated into the boilerplate code. The testing framework was built with the help of Spectron, Mocha, and Chai. The test cases can run using the following command.
npm run test
Packaging
Package the application using the following command:
npm run package
If you want to do cross-platform packaging(Windows and Linux build from Mac machine or Windows build from Linux machine), you have to make few platform-specific changes in the build script as well as in the build configuration.
Use Cases
The Create-electron-app is suitable for all kinds of Electron applications, and all the modules that are available as part of this boilerplate are configurable. The default UI framework here is React, though any UI framework or application data management framework instead of React and Redux is applicable.
Shreeshaila
#IT | 2 Min Read
Share:
Speech Recognition is an important feature in several applications, such as home automation, artificial intelligence, etc. This article provides an introduction to converting an audio file to text using the Speech Recognition library of Python.
How does speech recognition work?
First, internally the input physical audio will convert into electric signals. The electric signals convert into digital data with an analog-to-digital converter. Then, the digitized model can be used to transcribe the audio into text.
Installing the Python Speech Recognition Module
sudo pip3 install SpeechRecognition
This is the simplest way to install the SpeechRecognition Module.
Audio files that support speech recognition are wav, AIFF, AIFF-C, and FLAC. I have used the ‘wav’ file in this example.
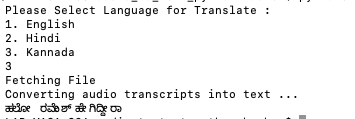
Steps to convert audio file to text
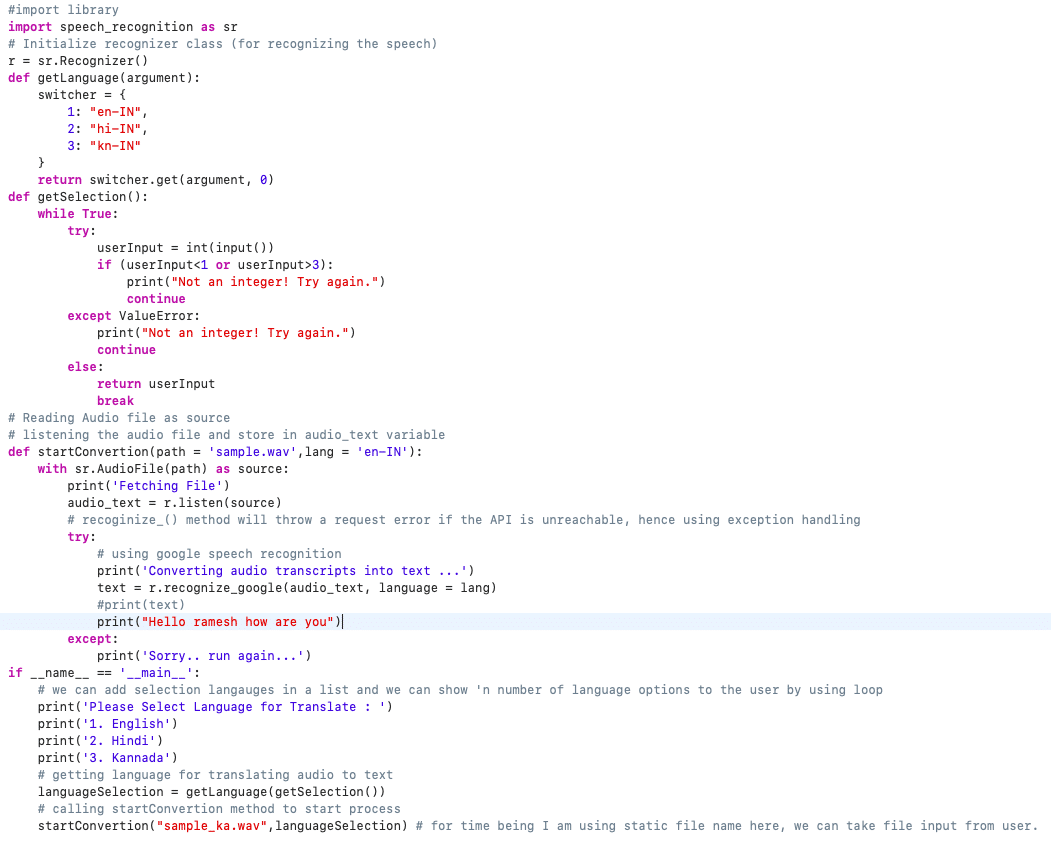
Step 1: Import speech_recognition as speechRecognition. #import library
Step 2: speechRecognition.Recognizer() # Initializing recognizer class in order to recognize the speech. We are using google speech recognition.
Step 3: recogniser.recognize_google(audio_text) # Converting audio transcripts into text.
Step 4: Converting specific language audio to text.
Code Snippet
Audio file to text conversion
def startConvertion(path = 'sample.wav',lang = 'en-IN'):
    with sr.AudioFile(path) as source:
        print('Fetching File')
        audio_text = r.listen(source)
        # recoginize_() method will throw a request error if the API is unreachable, hence using exception handling
        try:

            # using google speech recognition
            print('Converting audio transcripts into text ...')
            text = r.recognize_google(audio_text)
            print(text)

        except:
            print('Sorry.. run again...')
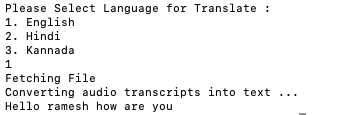
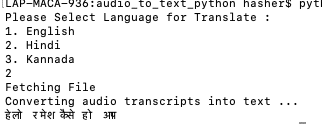
How about converting different audio languages?
For example, if we want to read a Hindi language audio file, then we need to add a language option in recogonize_google. The remaining code remains the same.
recognize_google(audio_text, language = lang)
Please refer this link for language code:
https://cloud.google.com/speech-to-text/docs/languages Example:
recognize_google(audio_text, language = "hi-IN")
Full Code: Output English audio Hindi audio Kannada audio
This blog demonstrates how to convert different language audio files using the Google speech recognition API. Google speech recognition API is an easy method to convert speech into text, but for it to operate, it requires an internet connection.
If you have anything to add, please feel free to leave a comment.
Thanks for reading.
Thanmayi Devaladakere
#General | 3 Min Read
Share:
Organizations in the current era are becoming a robotic venture for several individuals. The essence of providing constructive feedback or maintaining radical honesty is a long-gone task. As an exception, one of the core values of HashedIn is “radical honesty”. Several individuals linger on with the dilemma, is radical honesty all about sharing honest feedback and refraining ourselves from telling white lies? Well, the answer is, definitely not, it is also about accepting the direct, honest feedback and criticism gracefully. Wonders can happen if we follow “radical honesty” because it is directly related to your performance, in turn, the organizational performance. If radical honesty is not followed at the workplace, there is no constructive room for healthy feedback which can result in a false sense that everything is fine, and no improvement is needed.
Since a while, I have set a reminder to read this quote every day which has helped me to control my emotional outburst/ emotional reaction at the workplace, which you can try too – “ When you react, you let others control you but when you respond, you are in control”. The key point to note here is that you don’t need to react to everything and take it to heart and feel bad about it, especially at the workplace. I know, you might feel that it is difficult to put into practice, and looks good only in the books. But think it over, with little patience and continuous practice this can be achieved.
Here are a few tricks by which you can get away and get something good from criticisms:
Avoid the “biggest mistake” i.e taking criticism personally. Remember, every human is bound to make mistakes. Even the person who criticized you for sure would have committed mistakes and learnt lessons from them!
Do not get defensive and get into an argument. Listen and thank the concerned individual for sharing the criticism. You don’t need to immediately give a repulsive reaction. Take time to think and ask clarifying questions and understand how you can improve or if it is just a misconception, then clarify it in a polite way.
Respect and learn from each of the critics. Always think that the intention is right and there is scope to learn. The moment you start thinking about how the person is or was the intention right or it had a bad intention, you will lose it. Be open to take criticism and learn from them. Try not to give a chance for the person to come up with similar feedback.
By now, you must be thinking, are all criticisms good and how to deal with negative intentions, personal attacks, unfair, and unpleasant. In all these cases, talk to the person openly when things are calm. Say thank you, for sharing the feedback but it was unpleasant or could have been shared in a better way. Talk to the person directly rather than bad-mouthing about it.
Handling criticism at work might never be enjoyable. However, it is possible to learn to make the best out of it. Listen carefully and develop a plan for improvement based on what you hear. If you can be mindful and follow these tips, you may find the path to grow and succeed in your career.
Manish Dave
#Data Engineering | 7 Min Read
Share:
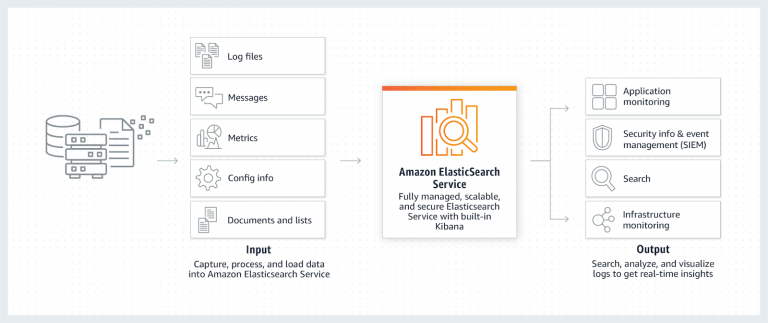
Amazon Elasticsearch Service is a fully managed service that enables you to search, analyze, and visualize your log data cost-effectively, at petabyte-scale. It manages the setup, deployment, configuration, patching, and monitoring of your Elasticsearch clusters for you, so you can spend less time managing your clusters and more time building your applications. With a few clicks in the AWS console, you can create highly scalable, secure, and available Elasticsearch clusters.
How is AWS Elasticsearch Costs Calculated?
Elasticsearch consists of Master and Data nodes. AWS ES does not cost anything for the usage of service. The only cost you bear is the instance code. Here are 2 types of nodes in ES.
Master nodes
Master nodes play a key role in cluster stability, and that’s why we recommend using a minimum of 3 dedicated master nodes for production clusters, spread across 3 AZs for HA. It doesn’t have additional storage requirements, so only compute costs are incurred.
Data nodes
Deploying your data nodes into three Availability Zones can also improve the availability of your domain. When you create a new domain, consider the following factors:
Number of Availability Zones
Number of replicas
Number of nodes
Note that all types of EC2 instances are not available for ES, only a subset is allowed to run as either data or master node.
Don’t use T2 instances as data nodes or dedicated master nodes. As these are burstable, you don’t get dedicated CPUs. Also, they don’t allow UltraWarm setup for cost-effectiveness.
Storage
Another factor to consider while tracking cost is EBS Storage attached to data nodes. Even though storage costs are smaller compared to nodes, on a petaByte scale, it becomes significant. Use provisioned IOPS only when it is required; these cost 1.5x of general-purpose SSD.
UltraWarm
This is an option with AWS ES to optimize storage and, thus, cost. With UltraWarm Enabled, you will have another node which moves your infrequently accessed data to S3, instead of EBS. Choosing S3 saves costs for archived or infrequent accessed data. The only cost you pay with UltraWarm is the cost of the chosen storage. UltraWarm has 2 node types – Medium(1.6 TB capacity) and Large(20 TB capacity). And the minimum number of node types is 2, i.e. 2 medium or 2 large. Choose this option only when you are dealing with large scale storage.
Elasticsearch Monitoring & Analysis
The first step to optimize cost is to become cost and usage aware; monitor existing domain with these tools.
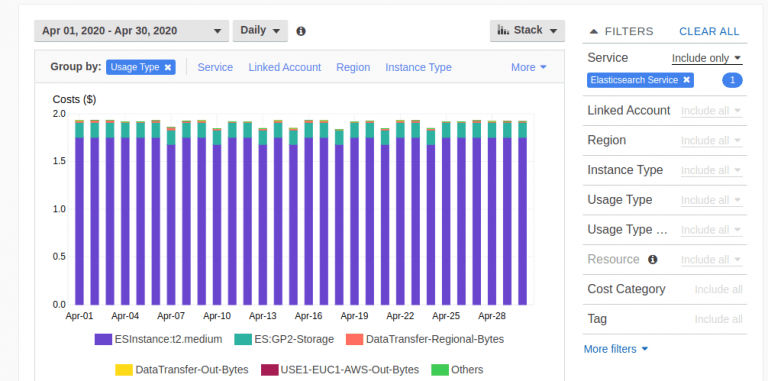
AWS Cost Explorer
Use billing and cost explorer services to get a breakdown of the total cost.
Event Monitoring
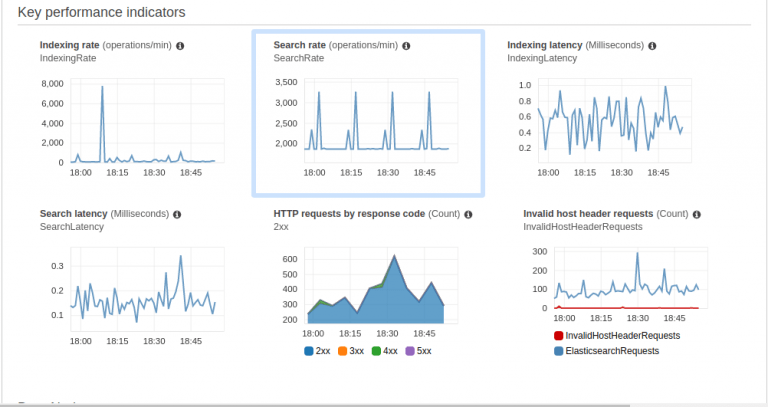
Amazon Elasticsearch Service provides built-in event monitoring and alerting, enabling you to monitor the data stored in your cluster and automatically send notifications based on pre-configured thresholds. Built using the Open Distro for Elasticsearch alerting plugin, this feature allows you to configure and manage alerts using your Kibana interface and the REST API, and receive notifications.
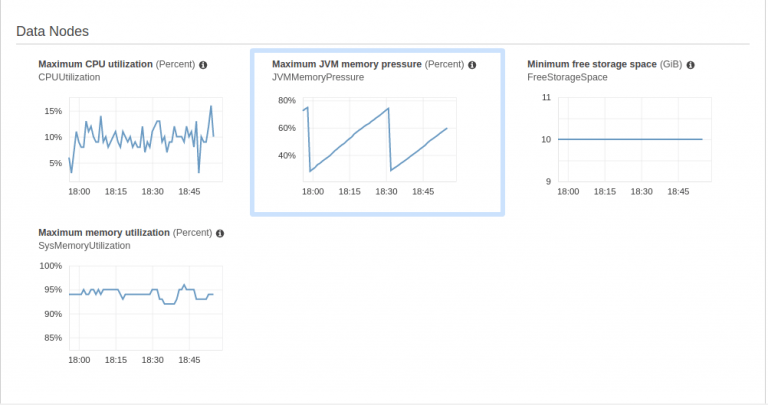
Here are some screenshots of those metrics. These allow you to understand the actual resource requirements of your ES domain.
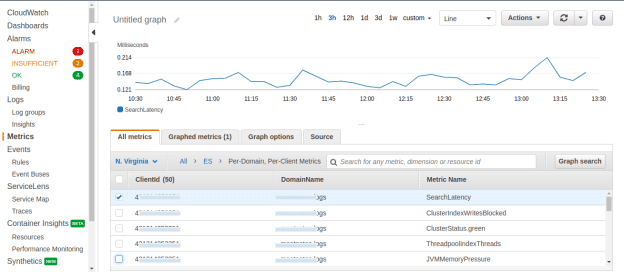
CloudWatch
You can also get CloudWatch-based metrics. These are charged per-metrics and per-domain basis, which helps in getting the insight into the utilization per node. Check out recommended metrics on the AWS website.
Controlling Elasticsearch costs
To control costs, you need to answer the following first based on the above metrics –
How many and what type of data nodes you need?
How many shards do you need?
How many replicas do you need?
How frequently do you access the data?
Pre-process your data -Most often we find redundant and duplicate events in our log files since we aggregate data from multiple sources. Hence, ensure that the data you store in ES is relevant, and also try to reduce or dedup your logs. Another type of preprocessing can be done by sending a reduced stream to Elasticsearch, and for this, you can use Kinesis Firehose.
Archive Data – Blocks of data that are accessed less frequently should be moved to S3 using UltraWarm if at all required. Use policies to run tasks like archival, re-indexing, deleting old indexes regularly, etc. to make it an automated process.
Overheads – Underlying OS and ES has its own storage overheads to run and manage nodes. So, you will have to provision a lot more than the actual source data. 5% of OS requirements per node, 20% of ES requirements per node, and 10% storage for indexes per node is minimum overhead; multiply all that by 2 to fulfill replica and HA requirements. Thus, the actual storage available is less than you pay for. An AWS recommended formula for same is –Source Data * (1 + Number of Replicas) * 1.45 = Minimum Storage Requirement
The number of shards – Each shard should have at least one replica. So, by choosing the wrong number of shards, you’re adding more than 2x the storage problem. A recommended way to calculate shards is provided by AWS, but a more pragmatic approach we took, was to break down your storage requirements into chunks of ~25 GBs. This size is big enough to properly use the available RAM size in nodes but not big enough to cause CPU errors by most node types, in AWS ES instance types. To be more specific, ensure that a single shard can be loaded in memory and processed easily. But, keep Memory Pressure in mind, i.e. only 75% of memory should be used by queries. Read more in the JVM section below.
Number of Nodes –If you read all the above points carefully and combine them, it makes sense for you to have a minimal number of nodes, i.e. 3 AZs should have 3 nodes. Fewer nodes will result in lesser overhead related wastage.
Use VPC – Using VPC and 3 different subnets for 3 AZs is not only secure, but you can also reduce the data transfer cost over the internet.
Use reserved instances – You can reserve instances for a one or three year term, to get significant cost savings on usage as compared to on-demand instances.
Snapshots – You can build data durability for your Amazon Elasticsearch cluster through automated and manual snapshots. A manual backup will cost you S3 storage prices. By default, the Amazon Elasticsearch Service will automatically create hourly snapshots of each domain and retain them for 14 days at no extra charge. However, choosing manual or relying on automated snapshots should be a business decision based on affordable downtime, RTO, and RPO requirements.
JVM Factor – Elasticsearch is a java based application. Hence, it requires java virtual memory for the better running of an elasticsearch. Few tips –
Use memory-optimized instance types.
Avoid queries on wide ranges, such as wildcard queries.
Avoid sending a large number of requests at the same time.
Avoid aggregating on text fields. This helps prevent increases in field data. The more field data that you have, the more heap space is consumed. Use the GET _cluster/stats API operation to check field data. For more information about field data, see the Elastic website.
If you must aggregate on text fields, change the mapping type to a keyword. If JVM memory pressure gets too high, use the following API operations to clear the field data cache: POST /index_name/_cache/clear (index-level cache) and POST */_cache/clear (cluster-level cache).
Conclusion
Cost optimization is not a one time task, and you should keep a constant eye on the requirements and cost explorer to understand the exact need. Observe the monitoring charts, since, if the data reduces, then Elasticsearch usage will also reduce that can help in minimizing the number of nodes, shards, storage, and replicas.
Manish Dave
#Data Engineering | 5 Min Read
Share:
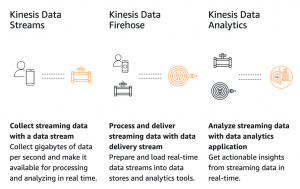
Amazon Kinesis Data Streams (KDS) is a massively scalable and durable real-time data streaming service. KDS can continuously capture gigabytes of data per second from various sources such as website clickstreams, database event streams, financial transactions, social media feeds, IT logs, and location-tracking events. The data collected is available in milliseconds to enable real-time analytics for real-time dashboards, real-time anomaly detection, dynamic pricing, etc.
For Kinesis cost control, like all other cost control measures, we shall follow the Awareness, Control, and Monitor Paradigm.
How are Kinesis Costs Calculated?
Amazon Kinesis Data Streams are made up of shards. A shard represents a sequence of records in a stream and is the base throughput unit. Kinesis Data Streams (or shards) has no upfront cost, and you only pay for the resources you use.
Each shard:
Has an ingest rate of 1 MiB/second or 1,000 records/second
Supports up to a maximum total data read rate of 2 MiB/second
Costs $0.015/shard/hour and $0.014/1 million PUT payload units
With Kinesis, you pay for the number of shards you use and for how long you use them. So, there is a lot of math to be done before you know how many shards you need and for how long.
Kinesis Monitoring & Analysis
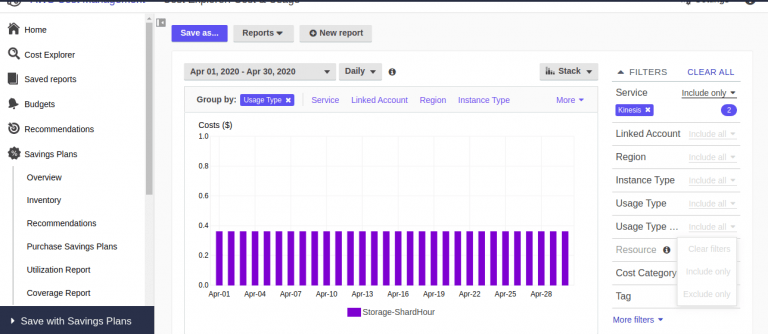
The first step is to optimize the cost is to become cost-aware by monitoring the existing shards with the available metrics. AWS Cost Explorer
With Cost Explorer, you can view the Kinesis cost breakdowns to the level of storage vs input vs output, based on API call filters. This helps you understand the usage type of your application.
Basic Monitoring
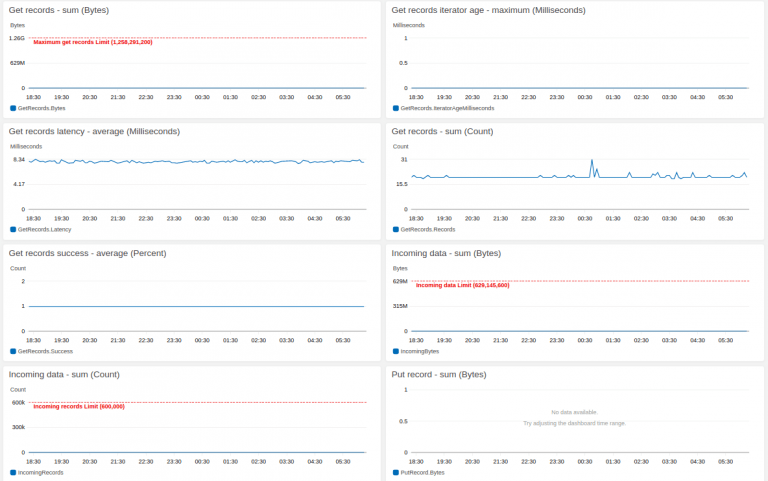
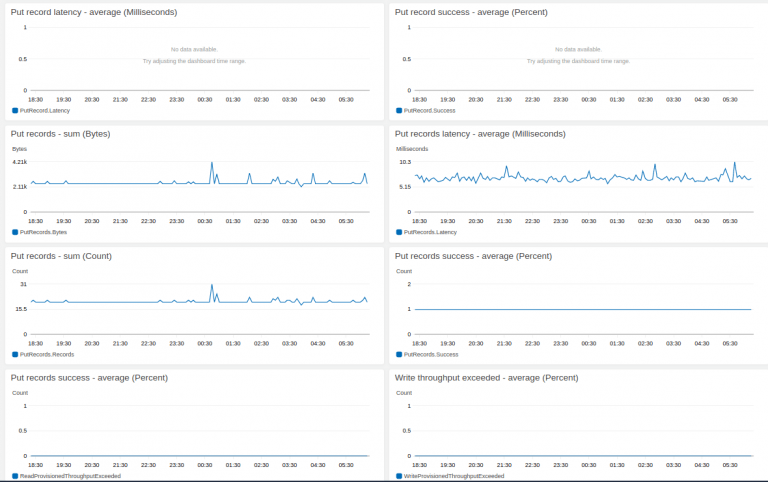
Stream-level data is sent automatically every minute at no charge. Here is a screenshot of the basic monitoring section. These graphs show – Get/Put record(s) – sum (Bytes and Count), Get records iterator age – maximum (Milli sec), Get/Put record(s) latency – average (milli sec), Get/Put records success – average (Percent), Incoming data – sum (Bytes and Count) and Write throughput exceeded – average.
If volumes of your Kinesis streams are fairly predictable and steady, then these graphs are enough to estimate the correct number of shards and capacity required.
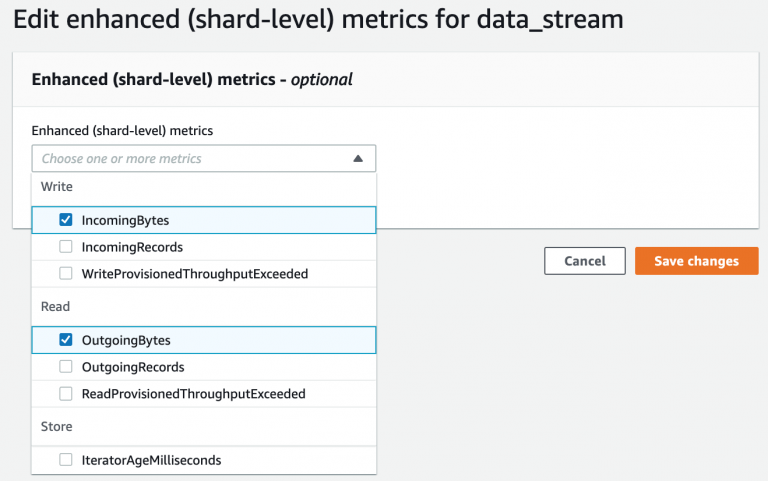
Enhanced (shard-level) Monitoring
If your application is not predictable and has extreme peaks in terms of data flow, then enable this option for a detailed individual shard level monitoring. Shard-level data is sent every minute for an additional cost. To get this level of data, you must specifically enable it for the stream using the EnableEnhancedMonitoring operation.
The following options are available for enhanced monitoring:
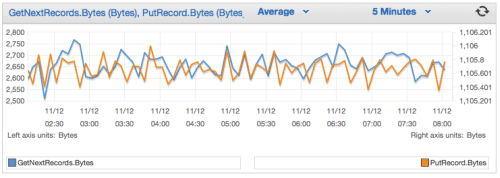
Here is an example of the monitoring metrics:
Once you are aware of your usage in Kinesis, then go through the following factors controlling Kinesis cost.
Controlling Kinesis Costs
Adjust the number of shards – Remove all the obsolete shards present in any region, as the number of shards, without input and output data flow, also incurs a cost. One shard can process up to 1000 records per second – you can calculate the number of ingests per second via monitoring (incoming) and launch the exact required shard, or can make modifications accordingly.
Pre-process the data – We already know that input stored and output data is counted as a cost in 3 different points, so it makes sense to reduce that data. Try to pre-process the data and only ingest a required subset of data. You may use AWS Lambda to do this.
Do not retain data for 7 days – This directly increases your storage requirements. It is absolutely not recommended unless there is a compliance requirement. By default, there is a retention period of 24 hours.
Implement Kinesis with an autoscale setup – This is to avoid over-committing the resources and scale only when required. Auto-scaling Kinesis is possible, but it brings new challenges. It can’t scale instantly, and you won’t get data from new shards until you finish handling the data from old shards.
Avoid enhanced fan-out – This feature means that there is one important consumer that requires a dedicated 2MB/sec/shard output. A consumer that uses enhanced fan-out doesn’t have to compete with other consumers that are receiving data from the stream. This is a massive bump up in the Kinesis cost. Kinesis is not for a dedicated throughput requirement, at least not for egress requirements of 2MB/sec/shard. Enhanced fan-out shard hours cost $36.00 (USD) per day!
Aggregate your PUT record size – The Kinesis cost is also calculated around PUT record size and count. Irrespective of whether your PUT record size is 4KB or more, it always gets round up to 25KB. Therefore, it makes sense for the application team to adjust record size to approximately 25KB.
Use Terraform/Cloudformation if the use case permits – If the application use case demands limited streaming or on-demand streaming, then use Terraform/Cloudformation to create a stream on-demand.
If you are aware of the time your app uses Kinesis – if it is once a day or once in a week use, you can automate the creation and pass the details with the provisioning tool.
Terminate once the process is done.
Reduce the size of data that is being read by shard – Max is 1 MB (ingest) and output data is a max of 2MB.
Conclusion
Cost optimization is not a one time task, you have to keep a constant eye on the requirements and the cost explorer, to understand the exact need. You have to keep an eye on the monitoring charts, because if the data reduces, then Kinesis usage will also reduce, which can help in reducing the number of shards.
You may want to check out https://comcastsamples.github.io/KinesisShardCalculator/ which will help you get a round figure on the Kinesis shard requirements.
Judelyn Gomes
#IT | 13 Min Read
Share:
Writing unit tests for the code is pretty much like regulation. It is considered a requirement nowadays and UI developers are not exempted from this. While UI tests might seem trivial at first, they serve a great role in big, complex projects with rich user interfaces. As a UI developer, user experience is at the heart and soul of the code you write. Therefore, tests are the best way to ensure you deliver that great experience.
In this blog post, I would like to share my learnings around React Testing Library and how to get started with writing unit tests with It.
Writing Maintainable Tests is Hard
Well, the problem is that writing tests that go the distance and can be maintained over time, as a project changes, is hard. To achieve maintainability with test cases, you want to avoid including implementation details of components because that will obviously face rounds of refactoring over time. Tests are meant to give us confidence, and getting caught up in updating code and tests side by side every time you make a small refactor can be exhausting.
Enter – React Testing Library
React Testing Library by Kent C Dodds aims to solve these issues with writing maintainable tests. It is a very light-weight solution for testing React components. It provides light utility functions on top of react-dom and react-dom/test-utils, in a way that encourages better testing practices. Its primary guiding principle is:
The more your tests resemble the way your software is used, the more confidence they can give you.
So rather than dealing with instances of rendered React components, and checking if a state is getting updated properly or props being passed are okay (which we can do with Enzyme by the way), instead our tests will work with actual DOM nodes. The utilities this library provides facilitate querying the DOM in the same way the user would. Finding elements by their label text (just like a user would), finding links, and buttons from their text (like a user would).
You can also find elements in DOM by giving them a data-tested prop as an “escape hatch” for elements where the text content and label do not make sense or is not practical.
React Testing Library encourages our applications to be more accessible and allows us to get our tests closer to the way the users will use them.
This library is a replacement for Enzyme. While you can follow these guidelines using Enzyme itself, enforcing this is harder because of all the amazing tools and utilities that Enzyme provides.
Unit Testing Steps
Unit tests more or less are a 3 step process:
Arrange – Where we arrange/render your components.
Act – Where we simulate actions on rendered components.
Assert – Where we assert our evaluations for expected results.
Writing Tests with React Testing Library
Now that we are done with discussing unit testing in general, associated problems, and how React Testing Library aims to solve these problems, it is imperative to write some tests using it to get a better understanding.
TLDR; You can find the example code sandbox here.
In our example, we’ll write tests for a very basic, custom select component I wrote for this post.
SETUP
We begin writing our unit tests by importing react and then importing the required utilities from “@testing-library/react” in the second line by using:
import { render, fireEvent, cleanup, wait } from “@testing-library/react”
Further, we import the component we want to test, in this case the Select component. In the testing world, a group of related test cases is called a suite. We’ll place all our tests in a test suite as well, which can be created using describe.
describe("Test Suite Description", () => {

  ...individual test cases

})
Now that we’ve imported everything we need, and we’ve also created our empty test suite, let’s get ahead with writing some test cases. We’ll start simply by testing if our component renders correctly.
TEST 1: IF OUR COMPONENT RENDERS CORRECTLY
So we start basically by testing if our Select component renders correctly given the proper props. We write a unit test case, using test function as –
test("test description", () => {...test code})
Here’s the code for the test –
test("if component renders without crashing", () => {
const { getByText, getByAltText } = render()
const controlElement = getByRole("button")
fireEvent.click(controlElement)
// query for menu list on the DOM
const menuList = getByRole("menu-list")
const dropdownIndicator = getByRole("img")
expect(dropdownIndicator).toHaveAttribute("alt", "dropdown indicator up")
expect(menuList).toBeInTheDocument()
// click again to close the menu list
fireEvent.click(controlElement)
expect(dropdownIndicator).toHaveAttribute("alt", "dropdown indicator down")
expect(menuList).not.toBeInTheDocument()
})
In this second test case, we’d like to test if our menu list shows up, once the control element is clicked. We’ll proceed by rendering the Select component with options. We’ll use the getByRole query function to query for role button on the DOM, and using this control element, we’d like to fire a click event on it using fireEvent imported earlier from react-testing-library. As per spec, this click should trigger the menu list to show up on the DOM. To assert that, we’ll again query DOM for the role of “menu-list” which we gave to our menu list in code using the same getByRole query method. We’ll also query the dropdown indicator element as done in the earlier test. Since we have arranged the elements now, it is time to assert. We begin by using expect again to assert that the dropdown indicator element should have the alt attribute as “dropdown indicator-up” since the dropdown is open. Moreover, we expect our menu list element to be in the document since it is supposed to be visible on the clicking control element once. This is enough, but we go on to fire one more click event on the control element to verify if the menu list is closing properly as well. To assert that, we expect again after the click event for a dropdown indicator to have the alt attribute as “dropdown indicator down” and menu list element to not be in the document. It is simple enough and expects makes the syntax for assertion quite comprehensible.
Go ahead and run the tests using yarn test or npm test depending on your usage and if all is right, your tests should pass.
In case of failure Jest is nice enough to highlight quite clearly what went wrong, you can use this to debug your tests.
In this third one, we are going to test if our options are getting rendered correctly in the menu list. For that, we’ll begin by rendering the Select component using same old render method and pass it options as props. We’ll destructure getByRole and getAllByRole from the object returned by render. We’ll get our control element by querying for the role “button” using the getByRole query function. Then, to show up the menu list, we’ll fire a click event using fireEvent as done in the previous test. Quite easy till here. Then we’ll use getAllByRole to get all elements with the role of option which we’ve given to our option elements in code. This will return an array of elements having a role as an option. Finally, we’ll assert if the length of the array is the same as the length of the options passed using expect and toHaveLength.
You know how to run tests by now, so go ahead and run them. If everything is alright, all tests should pass and in case of failure, you will get nice error messages which will help you debug your tests.
TEST 4: IF THE RENDERED OPTIONS ARE CORRECT
test("If the rendered options are correct", () => {
const { getByRole, getByText } = render(
Alright, we’ve written three test cases by now, and I hope you’ve got some understanding of how to go about writing unit tests using react-testing-library. Let’s continue writing our tests and in this one, we’ll test if the rendered options are correct. By correct, I mean, if what we pass as an option is the thing being rendered in the menu list. Again, we’ll start by rendering the component using render and we’ll destructure getByRole and getByText query functions from It. We’ll employ getByRole to get the control element and using it we’ll fire a click event using fireEvent. Fairly simple, we’ve done it before nothing new. Clicking the control element should render our menu list, which we’ve tested already in the previous tests. Now, we’ll go ahead and test if the options in that menu list correspond to the options passed as props. We’ll loop on the options array and for each option, we’ll get an element from DOM having the text as label string of the option and we’ll expect it to be visible. It might seem a little complex but is quite simple. We just want to query an element in DOM with text content as a label of an option and that option should be visible. We’d like this to be tested for each of the options, hence the for each loop. You can run the tests again and see if they pass or fail.
TEST 5: IF SELECTING AN OPTION IS WORKING
test("if selecting an option is working", () => {
const { getByRole, getByText } = render(
We’ve tested more or less everything about our Select component except one, which is if selecting an option works, which we are going to do in this final test. So once again, we are going to start by rendering the component using render function and from the returned object, we’d like to get getByRole and getByText query functions. We’ll query and get hold of our control element using getByRole. To select an option, we need to open the menu list first, so we’ll open the menu list by firing a click event on the control element using fireEvent. Now since we have all the options visible, we’d like to test if clicking on the first one, selects it i.e sets it as the selected option reflected via text of control element. To do this, we’ll fire another click event on the second option element queried from DOM using getByText on second options’ label text. We know that under the hood, once we click the option, some state update is triggered and state updation is not synchronous in React, so we need to wait for state updation to occur before asserting. We can wait using the wait function from @testing-library/react imported above.
The wait takes two arguments, the first one is the function to be executed and the second is an optional configuration object. The default timeout is 4500ms for wait function, you can give your own timeout as part of the optional configuration object. The wait is a part of async utilities provided by react-testing-library which makes testing asynchronous code really easy.
Back to the test, we wait for a control element to have text content the same as the label of the selected option. We do this using expect and toHaveTextContent matcher.
Now that we are done, you can run the tests again using a yarn test or npm run test to see if your tests pass or fail. If you’ve followed correctly, all tests should pass.
RUNNING TESTS IN ISOLATION
We want our tests to run in isolation so that the effects of the previous test don’t influence the current one. The React Testing Library provides a function called Cleanup which as the name suggests cleans up the test and all the side effects created by that test. Cleanup is called after each test automatically by default if the testing framework you’re using supports the afterEach global, or you can put it there yourself as shown using afterEach function from Jest, which runs after each test and expects a function as an argument. We can pass our Cleanup function to afterEach so that after each test completes, Cleanup cleans it up, ensuring the next test is unaffected by the execution of the previous one.
Closing Notes
Alright, so that was a brisk introduction to writing unit tests with React Testing Library. I hope this post smoothens out the initial friction in picking up React Testing Library for unit testing React applications. For more, check out the Documentation and do not forget to follow Kent C Dodds on Twitter!
Judelyn Gomes
#Data Engineering | 4 Min Read
Share:
The second week at HashedIn University witnessed a guest lecture by Mr. Nikhil Mathur, Partner Lead – Data Analytics, & AI/ML, India & SAARC, Amazon Internet Services who has over 15 years of work experience across several reputed companies. The world of technology has transformed over the past 10 years, as Data & Analytics, Artificial Intelligence, and Machine Learning came to the fore.
Data is something which can be derived not just from structured data sources but from twitter feeds, and various other sources that are unstructured. Data finds a new meaning when you then apply cloud computing to it. With the cloud, companies are free of the dilemma of choosing what to retain and store, and what to not. Organizations want to leverage data to fuel innovation and convert it for business advantage.
How are organizations using data?
Organizations are driven to grow their business exponentially using new data sources they have at their disposal. Moreover, data has become increasingly diverse and can be used and analyzed by various applications. Data and analytics are now needed to drive necessary insights and make valid decisions for the benefit of an organization. Stakeholders across an organization seeking to make sense of this data, drive more revenues, and reduce costs.
Are traditional data warehouses perishing?
Traditional data warehouses are evolving. With the input of data from various sources and feeds, intelligence is derived and data lakes are born. Here are some of the major reasons that make the data lake architectures useful:
Extends or evolves the Data Warehouse (DW) architecture.
It provides the capability to store any data in any format.
Secure, compliant, and auditable.
Runs any type of analytics from DW to predictive.
From moving data and getting it on the cloud from anywhere, there are a bunch of services that pave a way to process and protect your data. The AWS analytics portfolio covers the data journey from discovery to migration to the cloud. Once the data is on the cloud, there are several ways to archive the old data and aggregate existing data. A structured data analysis, serverless query, and search can also be integrated with the application to get insights from the data.
The importance of AI/ML:
In today’s digital world, the terms Artificial Intelligence (AI), Machine Learning (ML), and Deep Learning are often thrown around. But, what do they mean?
Artificial Intelligence is the field of computer science that mimics a machine to be a human brain, while ML is a subset of AI, where the machine learns on its own and performs tasks automatically. Deep learning is a subset of ML. If we were to compare it to the human brain, it is similar to neurons that are connected and trying to figure out patterns. These neural network algorithms can further dive deep and classify data. ML is a subset of AI and Deep Learning is a subset of ML.
Amazon has been using machine learning across the company for the past 20 years. For example, if you buy a product on Amazon, it will recommend similar products to you. These recommendations are powered by AI. So, why is everyone talking about AI/ML now?
More than a decade ago, the computational power and storage space required to do ML project was unavailable. The skilled professionals required were in limited supply, and the costs to run ML workloads were prohibitive. Today, with cloud computing, access to the infrastructure required is more pervasive, and the cost of doing ML has reduced significantly, making it more feasible to implement.
Today a developer in a small organization, can build, train, and deploy a model, and then derive inferences out of it. Today, although there has been a multi-fold growth in data, the computational time to process machine learning models has significantly reduced. AWS’s vision is to put machine learning in the hands of every developer
To quote Andy Jassy, CEO of AWS, “Invention requires two things: the ability to try lots of experiments, and not having to live with the collateral damage of failure.” With cloud analytics, the costs have come down significantly. You can pay for what you use, experiment a lot, fail fast, which ultimately leads to innovation. This helps companies grow and gives them a much- needed competitive advantage.
Anphy Jose
#Latest Blogs | 6 Min Read
Share:
Microservices have replaced the old Monolithic approaches of application deployment and paved a way for container technology to become very popular. Azure provides a number of options to run containers. Each of them has its own features, pricing, and complexity. Azure enhances the capability to deploy a virtual machine and enable containers in it, however for a production system it is of utter importance to use one of the below container services.
1. Azure Container Instances (ACI)
Azure Container Instance (ACI) is the simplest and quickest option to create and run containers in Azure. It is serverless and is best suitable for single-container deployments that don’t need to integrate with other Azure services (isolated containers).
Some of the features of ACI are as follows:
Serverless: Run the containers without managing servers
Fast startup: Launch containers in seconds.
Billing per second: Incur costs only while the container is running. No upfront or terminations fees
Hypervisor-level security: Isolate your application as completely as it would be in a VM.
Custom sizes: Specify exact values for CPU cores and memory.
Persistent storage: Mount Azure Files are shared directly to a container to retrieve and persist state.
Linux and Windows: Schedule both Windows and Linux containers using the same API.
Since it has a billing per second model, it is not recommended for applications that need to be run at 24X7. Instead, it is a good option for the Event-driven applications, Data processing jobs, provisioning of CI-CD pipelines, etc.
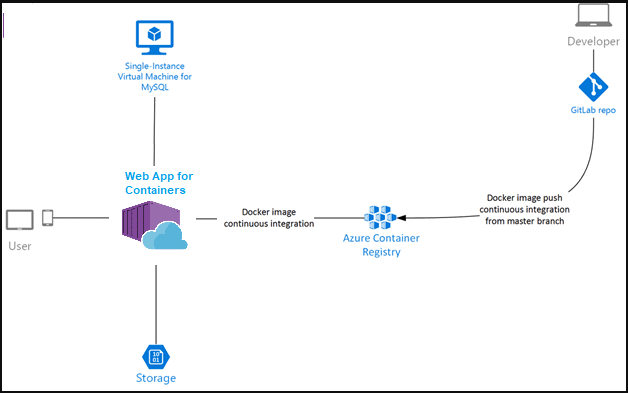
2. Web Apps for Containers (Azure App Services)
Azure Web Apps is a wonderful option for creating and hosting mission critical HTTP based applications in Azure. It supports languages like .Net, .NET Core, JAVA, Ruby, Python, Node.js, PHP. This makes Azure Web Apps also a good platform for deploying containerized web applications to Azure.
In this approach, the container image is pushed to a Docker Hub or a private Azure Container Registry using CI/CD pipelines and is deployed to Azure Web Apps.
Note: Azure Container Registry is Microsoft’s solution for securely storing the container images.
Some of the features of Azure Web Apps for Containers are
Deployment in Seconds
Easy integration with other Azure services
Supports auto-scaling, staging slots, and automatic deployment
Manage environment variables
Rich monitoring experiences
Enhances security features like configuring SSL certificates, IP whitelisting, AD Authentication
Helps enable CDN
Ability to host windows and Linux based containers.
3. Azure Batch
Azure Batch helps to run a large set of batch jobs on Azure. With this approach, the batch jobs are run inside the Docker compatible containers on the nodes. This is a good option for running and scheduling repetitive computing jobs.
4. Azure Service Fabric
Azure Service Fabric is a container orchestrator for managing and deploying microservices in Azure. This is the most mature platform for deploying windows based containers so that Microsoft itself uses Service Fabric for its own products like CosmosDB, Azure SQL Database, Skype for Business, Azure IoT Hubs, Azure Event Hubs, etc.
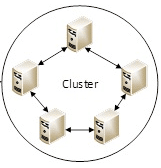
With this, the microservices are deployed across a cluster of machines. The individual machines in the cluster are known as nodes. A cluster can have both Windows and Linux based nodes.
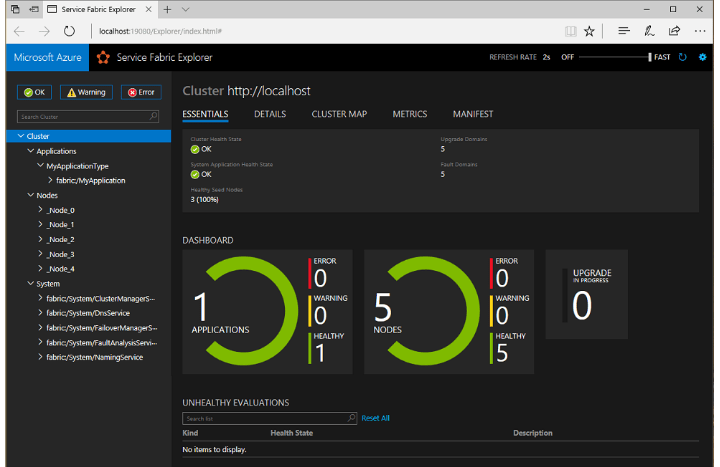
Service Fabric Explorer provides a rich and powerful dashboard for continuously monitoring the microservices across all the clusters and its nodes.
The key features of Service Fabric are as follows:
Has a container Orchestrator Platform which can run anywhere – Windows/Linux, On-Premise or other clouds
Scales up to thousands of machines
Runs anything, depends on your choice of a programming model
Deployment in Seconds and IDE integration
Service to Service communication
Recovery from hardware failures, Auto Scaling
Supports Stateful and Stateless services.
Security and Support for Role-Based Access Control
Service Fabric Mesh provides a more simple deployment model which is completely serverless. Unlike Service Fabric, with Service Fabric Mesh there is no overhead of managing clusters and patching operations. It is Microsoft’s SaaS offering based on Service Fabric and runs only in Azure.
Service Fabric Mesh supports both Windows and Linux containers with any programming language and framework.
5. Azure Kubernetes Services (AKS)
Azure Kubernetes Services is a managed cluster with a Kubernetes orchestrator in Azure. The Kubernetes master is fully managed by Azure and free. We only need to manage and pay for the worker nodes and any other infrastructure resources like storage and networking.
Some of the key features of AKS are as follows:
Ability to orchestrate applications without the operational overhead
Identity and Security Management with the integration of Azure AD
Integrated logging and monitoring
Elastic Scale
Support for version upgrades
Simplified deployment
Security and support for Role-Based Access Control
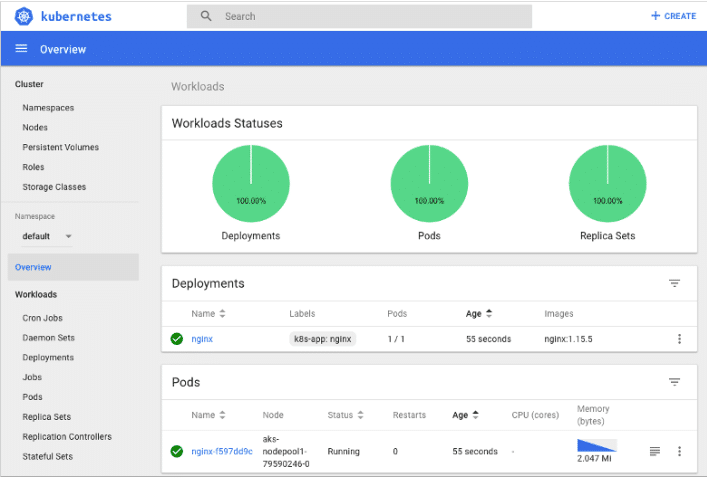
Azure also provides AKS Dashboard which helps to manage the Azure Kubernetes Services.
Service Fabric vs Azure Kubernetes Service
Both Service Fabric and Azure Kubernetes are wonderful platforms that help in hosting and managing microservices. Both provide features like scheduling, health monitoring, scaling, service discovery, and upgrades. Service Fabric is Microsoft’s first solution for container orchestration. It is a good choice for hosting Windows Containers and has good support for .Net Framework. It focuses on running applications with .NET or Java libraries provided by Microsoft. Hence, if there is a lot of legacy .Net code and when there is a need to introduce microservice, Service Fabric is a good choice. However, if the application should be able to be hosted in other cloud providers as well, Azure Kubernetes is a better option. Or if you use Linux and want to containerize your application then Azure Kubernetes is the better option. Also, use AKS if you are using any open source tools and not the IDE supported with Azure Service Fabric. Kubernetes is itself a leading provider for containerization and has a large set of resources and documentation, whereas with Azure Service Fabric we need to rely only on Microsoft provided resources. Service Fabric also has more operational overhead around node management when compared to AKS.
In addition to all the above services, there is also Azure Red Hat OpenShift which is a fully managed deployment of OpenShift on Azure developed by both Microsoft and Red Hat.
Which Azure container service should I use for my container?
Choosing the right container service in Azure is important and it depends on the application needs. Below are some of the use cases for each Azure offerings. Also please refer to the official Azure documentation for this.
Azure Offering
Azure Offering
Use Case
Azure Container Instance
For bursting work load
Azure Web Apps for Containers
For hosting small web applications.
Azure Batch
For running batch jobs
Azure Service Fabric
Development of Windows based Microservices or for any legacy .Net based systems.
Azure Kubernetes Services
Complex distributed applications which need to have simple deployments and efficient use of resources
Anphy Jose
#Latest Blogs | 7 Min Read
Share:
Kubernetes is one of the trending and fastest adopted tools in the DevOps process due to its features like scalability, high availability, network management, and auto-healing. It can group ‘n’ number of containers into one logical unit for managing and deploying them easily. It works brilliantly with all kinds of infrastructure i.e. cloud, hybrid and on-premise.
This blog is intended for users who are willing to create a highly available cluster for stateful applications, on bare metal. This is certainly a challenging case for teams who are trying to avoid cloud provider lock-in.
HashedIn had one such opportunity to set up a HA K8s cluster for stateful application and deploying the microservice-based application on it. It was for one of the telecom giants in India and thus high availability and scale was a very important consideration.
K8s HA Rules
No single point of failure – All components of setup must be replicated and HA.
Failover for master – Setup must have multiple master nodes, all having access to the same worker nodes. Being a self-managed setup, the master will have to be managed separately as HA.
Master promotion – If all master fails then setup must promote any slave to master.
Load balancer – Ensuring that scale and failover seamlessly.
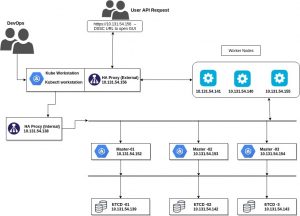
Infrastructure requirement
Since many of the users use managed K8s services like EKS, AKS, PKS, etc., which provide HA by default, it is easy to miss the High Availability aspect of a K8s cluster while setting it up on bare metal. Based on the above constraints and HA aspects on bare metal, here are few infrastructure pieces that we need to have to design HA K8s cluster –
3 master servers with connectivity between each other and etcd servers on port 2379 and 2380, as well as the worker nodes.
3 worker servers with connectivity to all the master servers.
3 etcd servers with connectivity to each other as well as the master servers. See them as DB for the K8s control plane. All information is replicated in these.
2 HAProxy servers with connectivity to the master servers. One(internal) for load balancing between master nodes and worker nodes. Another for external load balancing.
1 workstation with connectivity to all servers(like a bastion host). All K8s commands will run here and physical access to the cluster is allowed only through this server.
Architecture Design
* IPs are representational. You may use any CIDR.
Installations Required
These steps are relevant to Ubuntu and must be replaced with an equivalent for each OS –
Setup Bastion host
Setup K8s clusters
Setup HAProxy servers
Setup Helm and Tiller
Installation steps for Kubernetes HA cluster :
Kubespray is used to set up the K8s master and cluster. Kubespray uses Ansible internally to connect to all nodes and complete the configurations. To know more on the same please read the following link https://github.com/kubernetes-sigs/kubespray
Disable swap-on all the K8s servers and check the connectivity between all the servers using the following command: swapoff -a
Enable IP forwarding on all servers: echo "net.ipv4.ip_forward=1" >> /etc/sysctl.conf
Install dependencies from ”requirements.txt”: sudo pip install -r requirements.txt
Copy “inventory/sample” as “inventory/mycluster” : cp -rfp inventory/sample inventory/mycluster
Update Ansible inventory file with inventory builder :
curl -s https://packages.cloud.google.com/apt/doc/apt-key.gpg | sudo apt-key add -

sudo touch /etc/apt/sources.list.d/kubernetes.list

echo "deb http://apt.kubernetes.io/ kubernetes-xenial main" | sudo tee -a

/etc/apt/sources.list.d/kubernetes.list

sudo apt-get update

sudo apt-get install -y kubectl
Review and change parameters under “inventory/mycluster/group_vars” : cat inventory/mycluster/group_vars/all/all.yml
## We can add the load balancer details over here.
cat inventory/mycluster/group_vars/k8s-cluster/k8s-cluster.yml
## change the networking and other data as per your requirements.
Deploy the script as the root user: ansible-playbook -i inventory/mycluster/hosts.yml --become --become-user=root cluster.yml
Installation of HAProxy:
HAProxy will be installed as a package. apt update
apt install haproxy
Change the necessary configuration, according to your needs. Test the connection by accessing the URL of haproxy IP with the opened port.
Installing Workstation:
Here are the requirements for setting up a Bastion host/workstation. We will use Ansible for server configurations of all servers –
1. Install Ansible version >=2.7.2 on a workstation. A workstation should have SSH access to all K8s servers over port 22
2. Python3 should be installed on all servers including workstation
3. For further help on Ansible installation please refer – https://docs.ansible.com/ansible/latest/installation_guide/intro_installation.html#installing-ansible-on-ubuntu
4. Copy the /etc/kubernetes/admin.conf from one of the master servers to ~/.kube/config file present in the workstation server.
5. Install kubectl on the workstation server curl -s https://packages.cloud.google.com/apt/doc/apt-key.gpg | sudo apt-key add -
sudo touch /etc/apt/sources.list.d/kubernetes.list
echo "deb http://apt.kubernetes.io/ kubernetes-xenial main" | sudo tee -a
/etc/apt/sources.list.d/kubernetes.list
sudo apt-get update
sudo apt-get install -y kubectl
Now you can run the kubectl commands from here for the desired requirements.
Installation of Helm and Tiller:
Helm is a package manager and it has two parts to it, the client(CLI) and the server(Tiller). The client lives on your local workstation and the server lives on the Kubernetes cluster to execute what is needed. The idea is that you use the CLI to push the resources you need and the tiller will make sure that state is, in fact, the case by creating/updating/deleting resources from the chart.
The following command downloads and runs the shell script for helm: curl -L https://git.io/get_helm.sh | bash
Configure a service account for the tiller and install: kubectl create serviceaccount \
--namespace kube-system \
tiller
kubectl create clusterrolebinding tiller-cluster-role \
--clusterrole=cluster-admin \
--serviceaccount=kube-system:tiller
helm init --service-account tiller
helm version
Storage requirements – Dynamic Provisioning for stateful application:
The application required a dynamic allocation of DB and other storage. We used NFS for shared volume across servers. Here are steps you should use to set up dynamic provisioning of storage if your application is stateful.
Create one storage class for dynamic provisioning of DB on NFS: kind: StorageClass
apiVersion: storage.k8.io/v1
metadata:
name: managed-nfs-storage
provisioner: example.com/nfs
parameters:
archiveOnDelete: false
Apply above manifest file and run this command to verify: kubectl get storageclass/sc
For dynamic provisioning, we can execute the below command, which will install the NFS provisioner with the help of helm chart: helm install --set nfs.server=x.x.x.x --set nfs.path=/exported/path stable/nfs-client-provisioner
If you’re going for an on-premise setup of Kubernetes, this guide should help you give a high-level picture that often is missed when going for managed K8s services. Few important takeaways and things to explore in further details –
1. Provisioning dynamic storage with NFS.
2. Using a bastion host instead of a master node to control your K8s cluster by copying admin.conf file. You may also read about K8s RBAC to tighten up the security while using a bastion host.
3. No single point of failure is an essential part of any self-managed setup.
Manish Dave
#Latest Blogs | 5 Min Read
Share:
In the contemporary corporate environment, Kubernetes (“k8s”) have emerged as a system used for deploying applications, to efficiently use the containerized infrastructure by which the apps are powered. Companies can choose to run Kubernetes both on-premises or within a public Cloud. Managed K8s solutions can be availed through cloud systems like Azure, GCP, and AWS which can enable companies to swiftly get started and operate Kubernetes apps efficiently.
Due to its abstraction of all underlying layers, DevOps around the industry are concerned about the security levels that a Kubernetes implementation can provide. There are various levels at which security protocols need to be implemented. One of them is safeguarding sensitive information, synonymously referred to as Secrets, in Kubernetes that application uses. Secrets can be in the form of tokens, passwords, usernames, endpoints, API id, etc. Here we are going to talk about a few ways you can safeguard some of this sensitive information with K8s setup.
First, identify what needs to be saved as a Secret
Most of the Secrets are passed on as environment variables, so the first step to identify those environment variables is to identify what needs to be stored as Secrets e.g. there are variables which you need during a build (e.g. Commit Id), and some during deployment(e.g. Ports to open); few are required by an application to run(e.g. DB credentials). To identify which of these are actual candidates to be stored as Secrets.
Once secrets are identified, you can use the following ways to securely store and retrieve them from Kubernetes stack:
Built-in Kubernetes Secrets
Kubernetes offer a built-in mechanism for securely storing configuration values or ‘secrets’ that a company would want to keep private. Just like any other declarations in K8s, a Secret can also be either defined in a YAML file using kubectl apply -f or it can be passed through the command line using kubectl create secret command.
Kubernetes allows these Secrets to be RBAC i.e. you can define which Namespaces, Service Accounts, and their contents are allowed to access certain Secrets. K8s store this data as base64 encoded(not encrypted). These Secrets can be accessed using environment variables(env tag in YAML) or as attached volumes for Containers.
Like any other information about the K8s cluster, these Secrets are also stored on the cluster’s etcd DB in plaintext. And since etcd doesn’t provide encryption by default, you’ve to be very careful while using K8s in-built Secret Management. However, there are ways you can secure data at rest and in transit using tricks like using external KMS(key management service), enabling TLS and ensuring that only the Kube master can access the secrets.
Hence, it is prudent that companies choose to use third-party solutions to protect their secret data. There are three broad categories of secrets management solutions in the case of Kubernetes. They are:
Secrets management services from a certain cloud vendor.
Open source solutions that are run by the internal company staff, either in the cluster or nearby.
Proprietary solutions from a vendor.
Cloud Managed Secret Stores
Managed cloud solutions would be a good choice for companies who run their operations in one of the major public cloud systems and want swift services for secrets management. The common cloud secret services include:
AWS Secrets Manager:
This service is a part of the Amazon Web Services and has been designed to help companies to protect access to their IT resources, applications, and services. This service enables companies to easily manage, rotate and retrieve API keys, database credentials, and various other secrets throughout their lifecycle.
Cloud KMS:
This service allows companies to protect sensitive data in the Google Cloud Platform and efficiently manage cryptographic keys for their cloud services.
Azure Key Vault:
This Microsoft developed tool helps in both storing and accessing secrets, including API keys, passwords, and certificates.
Open Source Secrets Managers
Vault and Sealed Secrets are two popular open-source secret managers that are commonly chosen by companies that do not avail managed K8s services through any cloud platform.
Vault
The HashiCorps’s Vault is among the most popular and feature-rich secret management solutions used in Kubernetes. It is known to have more features than the typical cloud-managed solutions and is extremely secure as well. It additionally works perfectly with GKW and EKS, and just about anywhere a business may run Kubernetes. Cloud solutions, however, are much easier to set up and configure than a performant HA Vault cluster.
The major advantageous features of Vault include:
Completely private Cubbyholes where the token bearer would be the only one able to access the data.
Vault can automatically create accounts and credentials for businesses in databases and cloud IAMs.
SSH certificate and PKI certificate would allow businesses to generate and store certificates with a single API call.
Cross-region/Cross-Cloud/Cross Datacenter replication facilitating support for filters to restrict data that should not be transferred across diverse clusters
Support for a host of authentication methods, as well as where MFA is required
Sealed Secrets
The Sealed Secrets is known to work by running a controller inside the K8s cluster of a company that takes a secret data and a public key, while subsequently providing an encrypted string that can be used inside the typical configuration files and would be only decrypted by the controller having the relevant private key. This secret management solution enables companies to store secret credentials in configuration files in Git directly, and subsequently share the Git repository with all who would require accessing it while making sure that none of them would have access to the given credentials.
Keys and passwords are among the most important and widely used tools that contemporary organizations have for authenticating applications and users. Hence, they must choose the perfect secret management solution as per their business requirements and objectives.